Monitoring Improvements in oVirt
Recently I’ve been working on improving the scalability of monitoring in oVirt. That is, how to make oVirt-engine, the central management unit in the oVirt management system, able to process and report changes in a growing number of virtual machines that are running in a data-center. In this post I elaborate on what we did and share some measurements.
Background
Monitoring in oVirt
In short, oVirt is an open-source management platform for virtual data-centers. It allows centralized management of a distributed system of virtual machines, compute, storage and networking resources.
In this post the term monitoring refers to the mechanism that oVirt-engine, the central component in the oVirt distributed system, collects runtime data from hosts that virtual machines are running on and reports it to clients. Some examples of such runtime data:
- Statuses of hosts and VMs
- Statistics such as memory and cpu consumption
- Information about devices that are attached to VMs and hosts
Notable changes in the monitoring code in the past
@UnchangableByVdsm
Generally speaking, the monitoring gets runtime data reported from the hosts, compares it with the previously known data and process the changes.
In order to distinguish dynamic data that is reported by the hosts and dynamic data that is not reported by the hosts, we added in oVirt 3.5 an annotation called UnchangableByVdsm that should be put on every field in VmDynamic class that is not expected to be reported by the hosts. This was supposed to eliminate redundant saves of unchanged runtime data to the database.
Split hosts-monitoring and VMs-monitoring
Previously, before monitoring a host we locked the host and released it only after the host-related information and all information of VMs running on the host was processed. As a result, when doing an operation on a running VM, the host that the VM ran on was locked.
A major change in oVirt 3.5 was a refactoring the monitoring to use per-VM lock instead of the host lock while processing VM runtime data. That reduced the time that both monitoring and threads executing commands are locked.
Introduction of events based protocol with the hosts
A highly desirable enhancement came in oVirt 3.6 in which changes in VM runtime data are reported as events rather than by polling. In a typical data-center many of the VMs are ‘stable’, i.e. their status does not change much. In such environment, this change reduces the number of data sent on the wire and reduces the unnecessary processing in oVirt-engine.
Note that not all monitoring cycles were replaces with events: on every 15 seconds (by default), oVirt-engine still polls the statuses of all VMs, including their statistics. These cycles are called ‘statistics cycles’.
Scope of this work
An indication that monitoring is inefficient is when it works hard while the system is stable (I prefer the term ‘stable’ over ‘idle’ since the virtual machines could actually be in use). For example, when virtual machnines don’t change (no operation is done on these VMs and nothing in their environment is changed), one could expect the monitoring not to do anything except for processing and persisting statistics data (that is likely to change frequently).
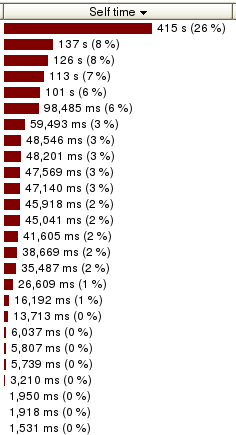
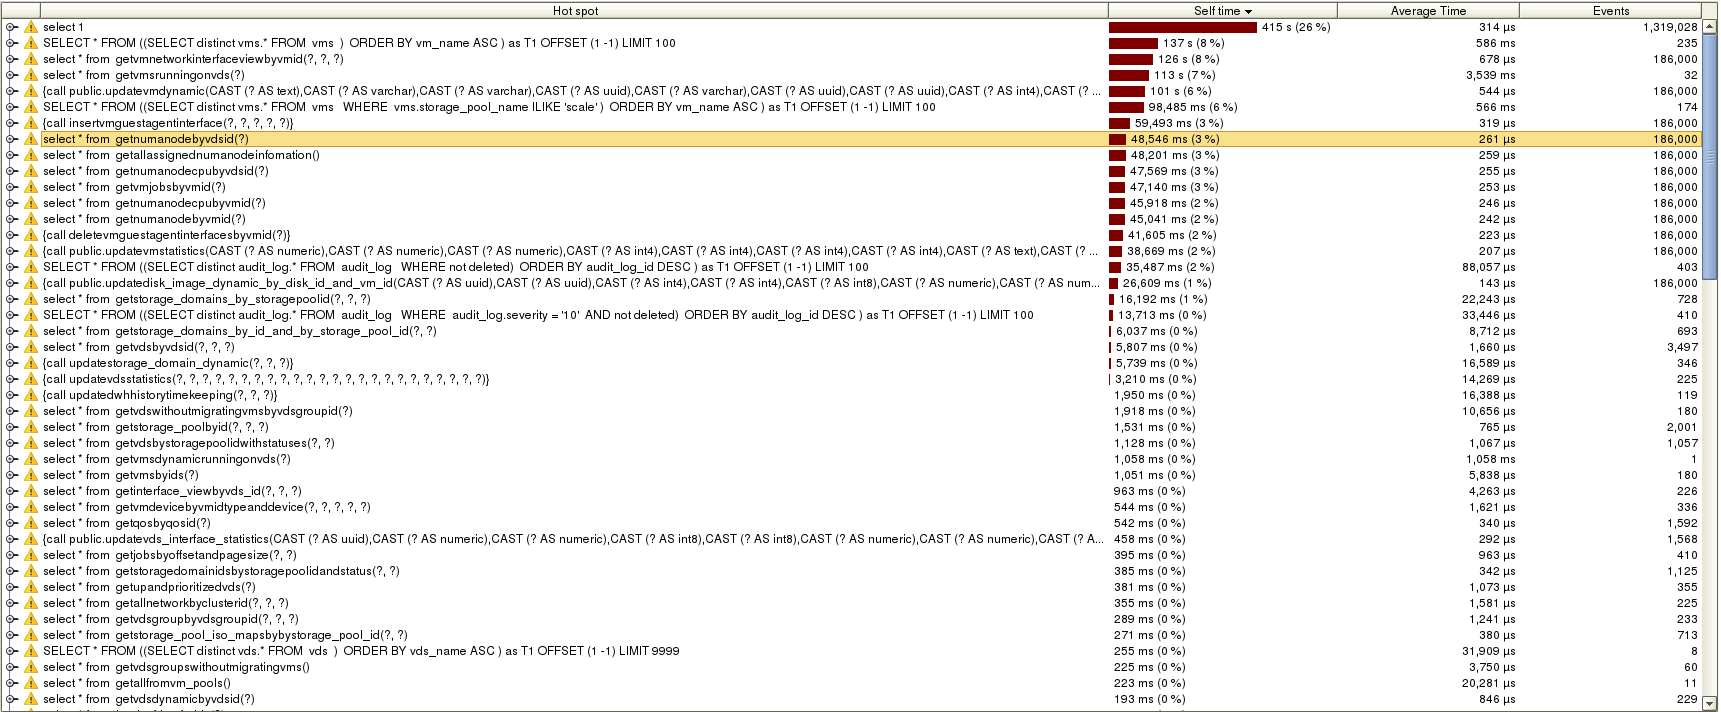
Unfortunately it was not the case in oVirt. The next figure shows the ‘self time’ of hot-spots in the interaction with the database in oVirt 3.6 during the time an environment with one host and 6000 VMs was stable for one hour. I will elaborate on these number later on, but for now just note that the red color is the overall execution time of database queries/updates. The more red color we see, the more busy the monitoring is.
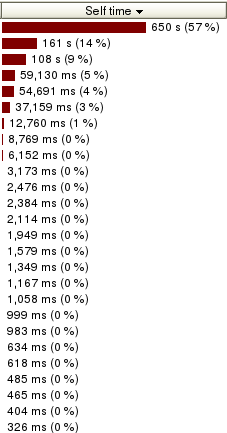
This work continues the effort to improve the monitoring in oVirt mentioned in the previous sub-section in order to address this particular problem. In the next section, I elaborate on the changes we did that lead to the reduced execution times shown in the next figure for the same enviroment and for the same time (look how much less red color!).
This work:
- Takes for granted that the monitoring in oVirt hinders its scalability.
- Does not change hosts monitoring.
- Does not refer to other optimizations we did that do not improve monitoring of a stable system.
Changes
Not to process numa nodes data when not needed
We saw that a significant effort was put to process runtime data of numa nodes.
In terms of CPU time, 8.1% (which is 235 seconds) was wasted on getting all numa nodes of the host from the database and 5.9% (which is 170 seconds) was wasted on getting all numa nodes of VMs from the database. The overall CPU time spent on processing numa node data got up to 14.6%! This finding is similar to what we saw in profiling dump we got for other scaled environment.
In terms of database interaction, getting this information is relatively cheap (the following are average numbers in micro-seconds):
- 261 to get numa nodes by host
- 259 to get assigned numa nodes
- 255 to get numa node CPU by host
- 246 to get numa node CPU by VM
- 242 to get numa nodes by VM
But these queries are called many times so the overall portion of these calls is significant:
- Getting numa nodes by host - 3% (48,546 msec)
- Getting assigned numa nodes - 3% (48,201 msec)
- Getting numa node CPU by host - 3% (47,569 msec)
- Getting numa node CPU by VM - 2% (45,918 msec)
- Getting numa nodes by VM - 2% (45,041 msec)
I used the term ‘wasted’ because my host did not report any VM related information about numa nodes! So in order to improve this we changed the analysis of VM’s data to skip processing (and fetching from the database) numa related data if no such data is reported for a VM.
Memoizing host’s numa nodes
But we cannot assume that hosts do not report numa nodes data for the VMs. So another improvement was to reduce the number of times it takes to query host’s level numa nodes data - by querying it on per-host basis instead of per-VM. That’s ok since this data does not change while we process data received from the host. We used the memoization technique to cache this information during host monitoring cycle.
Cache VM jobs
Another surprising finding was to see that we put a not negligible effort in processing and updating VM jobs (that is, jobs that represent live snapshot merges) without having a single job like that (the system is stable, remember?).
It gots up to 3.8% (111 sec) of the overall CPU time and 3% (47,140 msec) of the overall database interactions.
Therefore, another layer of in-memory management of VM jobs was added. Only when this layer detects that information should be retrieved from the database (and not all the data is cached) it access the database.
Reduce number of updates of dynamic VM data
Despite the use of @UnchangableByVdsm, I discovered that VM dynamic data (that includes for example, its status, ip of client console that is connected to it and so on) is updated. Again, no such update should occur in a stable system… The implications of this issue is significant because this is a per-VM operation so the time it takes is accumulated and in our environment got to 6% (101 sec) of the overall database interactions.
To solve this, VmDynamic was modified. Some of the fields that should not by compared against the reported data were marked with @UnchangableByVdsm and some fields that VmStatistics is a more appropriate place for them were moved.
Split VM devices monitoring from VMs monitoring
Hosts report the hash of the devices of each VM and the monitoring of the VMs used to compare this hash against the hash that was reported before, and triggers a poll request for full VM data, that contains information of the devices, only when the hash is changed. Not only that the code became more complicaed when it was tangled within other VM analysis computation, but a change in the hash triggered update of the whole VM dynamic data.
Therefore, we split the VM devices monitoring into a separate module that caches the device hashes and by that reduce even further the number of updates of VM dynamic data.
Lighter, dedicated monitoring views
Another observation from analyzing hot spots in the database interactions was that one of the queries we spend a lot of time on is the one for getting the network interface of the monitored VMs. This is a relatively cheap query, only 678 micro-sec on average, but it is called per-VM that therefore accumulated to 8% (126 sec) of the overall database interactions.
The way to improve it was by introducing another query that is based on a lighter view of network interfaces that contains only the information needed for the monitoring.
This technique was also used to improve the query for all VMs running on a given host. The following output depicts how much lighter is the new view (vms_monitoring_view) than the previous view the monitoring used (vms):
engine=> explain analyze select * from vms where run_on_vds='043f5638-f461-4d73-b62d-bc7ccc431429';
 Planning time: 2.947 ms
 Execution time: 765.774 ms
engine=> explain analyze select * from vms_monitoring_view where run_on_vds='043f5638-f461-4d73-b62d-bc7ccc431429';
 Planning time: 0.387 ms
 Execution time: 275.600 ms
This new view is used by the monitoring in oVirt 4.0 but as we will see later on the monitoring in oVirt 4.1 won’t use it anymore. Still, this new view is used in several other places instead of the costly ‘vms’ view.
In-memory management of VM statistics
The main argument for persisting data into a database is its ability to store information that should be recoverable after restart of the application. However, in oVirt the database is many times used in order to share data between threads and processes. This badly affects performance.
VM statistics is a type of data that is not supposed to be recoverable after restart of the application. Thus, one could expect it not to be persisted in the database. But in order share the statistics with thread that queries VMs for clients and with DWH, it used to be persisted.
As part of this work, VM statistics is no longer persisted into the database. They are now managed in-memory. Threads that query VMs for clients retrieve it from the memory, and for DWH we can dump the statistics in longer intervals to wherever it takes the statistics from. By not persisting the statistics, the number of saves to the database it reduced. In our environment it got to 2% (38,669 msec) of the overall database interactions. It also reduces the time it takes to query VMs for clients.
Query only VM dynamic data for VM analysis
So ‘vms_monitoring_view’ turned out to be much more efficient than ‘vms’ view as it returned only statistics, dynamic and static information of the VM (without additional information that is stored in different tables).
But obviously querying only the dynamic data is much more efficient than using the vms_monitoring_view:
engine=> explain analyze select * from vms_monitoring_view where run_on_vds='043f5638-f461-4d73-b62d-bc7ccc431429';
 Planning time: 0.405 ms
 Execution time: 275.850 ms
engine=> explain analyze select * from vm_dynamic where run_on_vds='043f5638-f461-4d73-b62d-bc7ccc431429';
 Planning time: 0.109 ms
 Execution time: 2.703 ms
So as part of this work, not only that VM statistics are no longer queried from the database but also the static data of the VM is no longer queried from the database by the monitoring. Each update is done through VmManager that caches only the information needed by the monitoring and the monitoring uses this data instead of getting it from the database. That way, only the dynamic data is queried from the database.
Eliminate redundant queries by VM pools monitoring
Not directly related to VMs monitoring, VM pool monitoring that is responsible for running prestarted VMs also affects the amount of work done in a stable system. As part of this work, the amount of interactions with the database by VM pool monitoring in system that doesn’t contain prestarted VMs was reduced.
Results
CPU
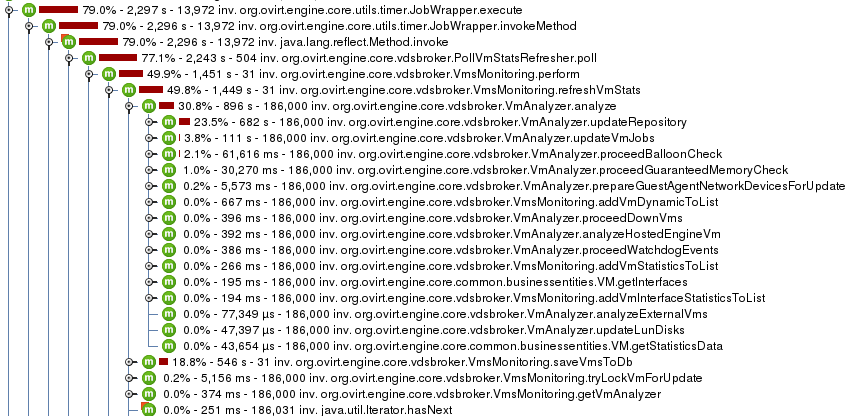
CPU view on oVirt 3.6:
CPU view on oVirt master:
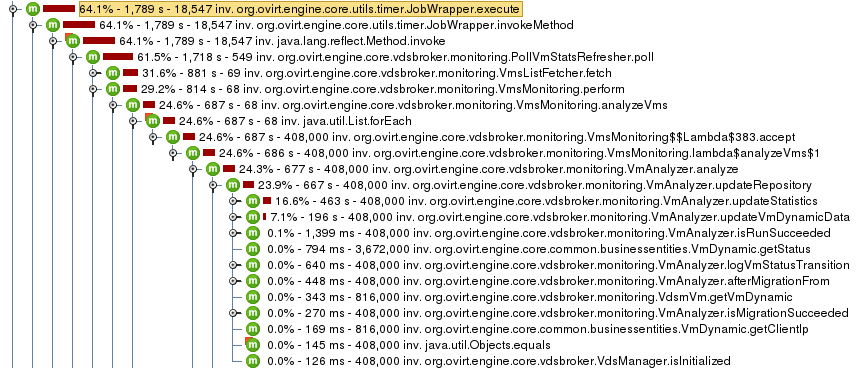
- The total CPU time used in one hour for the monitoring reduced from 2297 sec to 1789 sec.
- We spend significantly less time in the monitoring code - 814 sec instead of 1451 sec.
- The processing time reduced from 896 sec to 687 sec.
- The time it takes to persist changes to the database reduced from 546 sec to 114 sec.
Additional insight:
- The time spent on host monitoring increased from 40,730 msec in oVirt 3.6 to 53,447 msec when using ‘vms_monitoring_view’. Thus, in 4.0 it is probably even higher due to additional operations that were added.
Database
Database hot spots on oVirt 3.6:
Database hot spots on oVirt master:
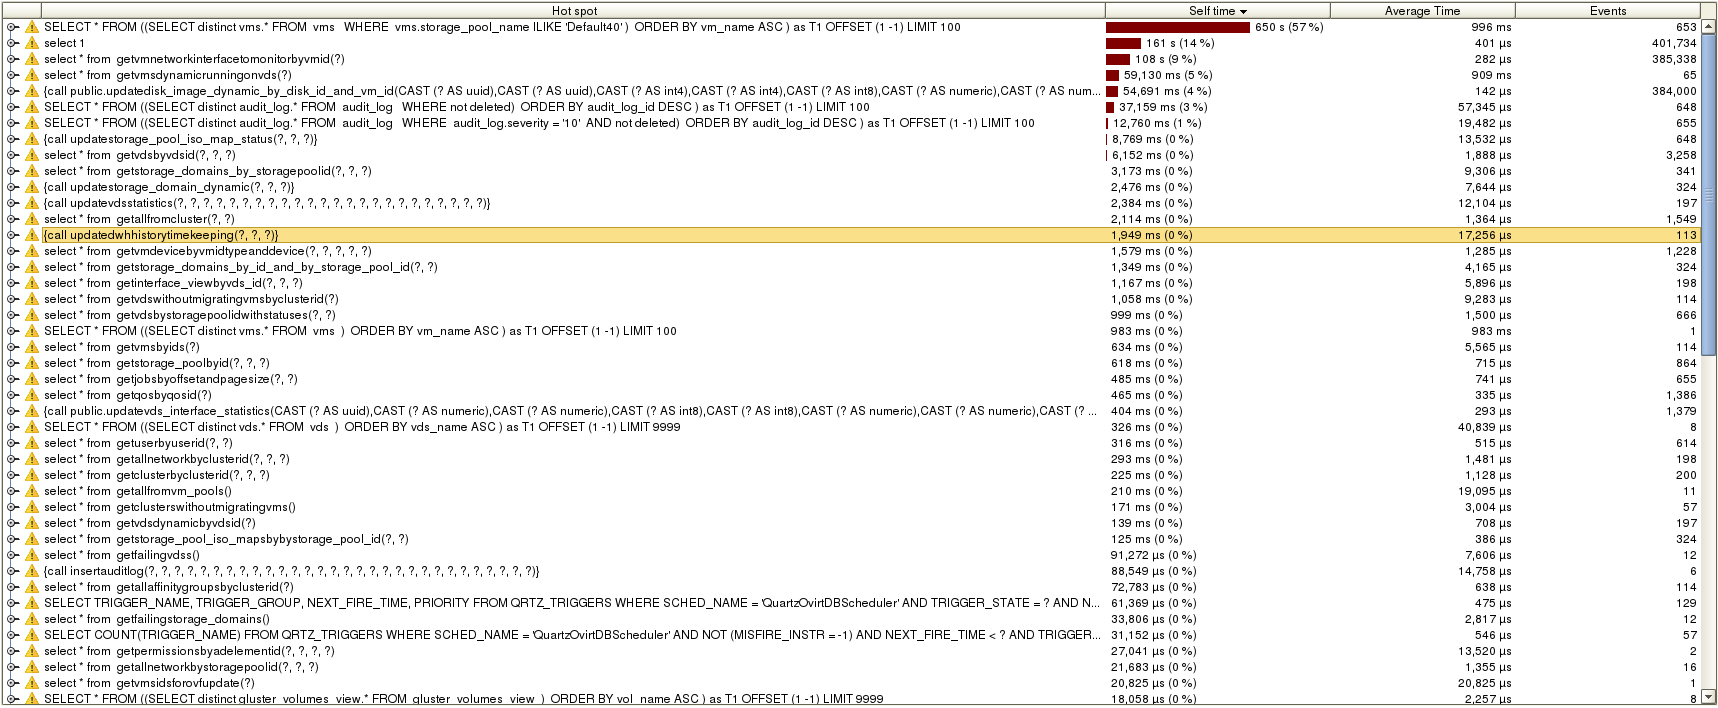
- The time to query network interfaces of VM reduced from 678 micro-sec on average to 282 micro-sec, resulting in overall improvement from 126 sec to 108 sec (it is called much more, I believe it is because postgres caches this differently now).
- The time it takes to query all the running VMs on the host reduced from 3,539 msec on average (!) to 909 msec, resulting in overall improvement from 113 sec to 59,130 msec thanks to querying only the dynamic data.
- The time it took to save the dynamic data of the VMs was 101 sec (6%, 544 micro-sec on average). On master, the dynamic data was not saved at all.
- All queries for numa nodes that were described before were not called on our environment.
- Same for the query of VM jobs.
- The update of VM statistics which took 261 micro-sec and 38,669 msec overall (2%) on oVirt 3.6, is not called anymore.
- Queries related to guest agent data on network interfaces that we spend time on in oVirt 3.6 (insert: 319 micro-sec on average, 59,493 msec overall which is 3% and delete: 223 micro-sec on average, 41,605 msec overall which is 2%) were not called on oVirt master.
More insights:
- Despite making the ‘regular’ VMs query lighter (since it does not include querying VM statistics from the database), it takes significatly more time on oVirt master: 996 msec on average while it used to be ~570 msec on average on oVirt 3.6.
- Updates of the dynamic data of disks seems to be also inefficient. Although it is relatively cheap (143 micro-sec on average) operation, the fact that it is done per-VM makes the overall time relatively high on master (4%), especially considering that these VMs had no disks..
- The overall time spent on querying VM network interfaces is still too much.
- An insight that I find hard to explain is the following diagrams of the executed database statements that are probably a result of caching in postgres (that might explain the reduced memory consumption we will see later):
Executed statements in oVirt 3.6:

Executed statements in oVirt master:

Memory
Memory consumption on oVirt 3.6:

Memory consumption on oVirt master:

One can argue that in-memory management like the one introduced for VM statistics or in-memory management layers over the database like the one introduced for VM jobs leads to high memory consumption.
Surprisingly, the memory consumption on master is lower than the one seen on 3.6. While at peaks (right before the garbage collector cleans it) the memory on oVirt 3.6 get to ~1.45 GB, on oVirt master it gets to ~1.2 GB. That is probably thanks to other improvements or by reducing the amount of caching by postgres that compansate the higher memory consumption by the monitoring.
Possible future work
- Although I refer to the code that includes the described changes as ‘master branch’, some of the changes are not yet merged so this work is not completed yet.
- Need to investigate what makes VMs query to take much longer on the master branch.
- Another improvement can be to replace the ‘statistics cycles’ polling with events. This could also prevent theoretical issues we currently have in the monitoring code.
- In order to create the testing environment I played a bit with environment running 6000 VMs (using fake-VDSM). It is very inconvenient via the webadmin currently. Better UI support for batch operations is something to consider.
- Also, we had an effort to introduce batch operations for operations on the hosts (like Run VM). We could consider batch scheduling that will allow us to resume that effort.
- Introduce in-memory layers for network interface and dynamic disk data as well.
- Split VM dynamic data to runtime data, that is reported by VDSM, and other kind of data to prevent redundant updates from happening again.
- Cache VM dynamic data. We planned to do it for VM statuses, but we should consider doing that for other kind of dynamic VM data.